02. Identifying the Skew in the Cost of Living
Developed or not, we have to consider the cost of living, inequality and other such parameters to compare 2 different nations

We, at least the common folks, usually paint the state of economy of world nations with a broad brush under the below categories:
1. Developed nations.
2. Developing nations and
3. Underdeveloped nations
We all know how grey the classification criteria are and we are not clear how it has changed over the period of time.
I have lived in India, UK and USA for a considerable period of time and have come to understand the dynamics of the life events of an average person and its interplay with the larger economy.
Let me compare the cost of living in UK and India and see if there is any ‘skew’.
I know that a study like this needs careful gathering and analysis of vast amounts of data. I do not have time or resources to commit to such a study. This article is based on general observations and is subjected to the below challenges that bother all researchers:
1. Lack of availability of data
2. Data proliferation leading to low quality of data that promotes confusions
3. Outdated data
4. Lack of sense of period of data collection for the data and lack of idea about its relevance today
5. Ability in means/time to verify the data sources
6. Difficulty in even searching for the right data source
I am also constrained by my limited knowledge of statistics and its related tools and techniques.
I used the below sites for my R&D to gain useful insights. They seem to be reasonable. Some of them also specify the time when the data was recorded.
and several other sites…
But before this let us compare some vital parameters of the country data of the 2 countries to set the stage.

Let us also look at some other statistics of the 2 countries.(I used numbeo.com, nimblefins.co.uk, google and many others)
Though the below data is usually segregated by cities, regions, and countries, and by urban/rural groupings, I am considering a approximate/guestimate value out of all segregations.

Let us look at the above tables and the figures sourced from internet given in the appendix:
Some Inferences from all of the above and the charts in the appendix:
1. UK is very well ahead in a number of country parameters and is classified as a developed country
2. Cost of living in India, is, on an average, lower than in UK
3. Rent in India, is on an average, lower than in UK
4. By comparing the income distribution curve shapes, I can infer that income distribution is more spread in UK as compared to India. The prices of food and essential goods are governed by the affordability of majority of the people and that is clearly on the lower end as seen in India data (If you are earning INR 25000/GBP 243 per month you are in the 90 percentile !!). This applies to the living expenses including the rental cost.
5. On the contrary, just by comparing median income of an average family to the living expenses (not including rent) and rental expenses separately, I am shocked to see that, in the UK, the fictitious average man is forced to spend beyond his means.
Considering this with the national debt per person, lower savings interest rate and lower propensity to save, it seems life is much more tough to live in UK for an average person. Seems, the economic fluctuations can unsettle people in UK much faster than in India.
6. Considering Figure 3, and point number 5, we get into a false sense of security that the developed countries are doing better. But factors like cost of living, inequality etc., sometimes point to the opposite understanding.
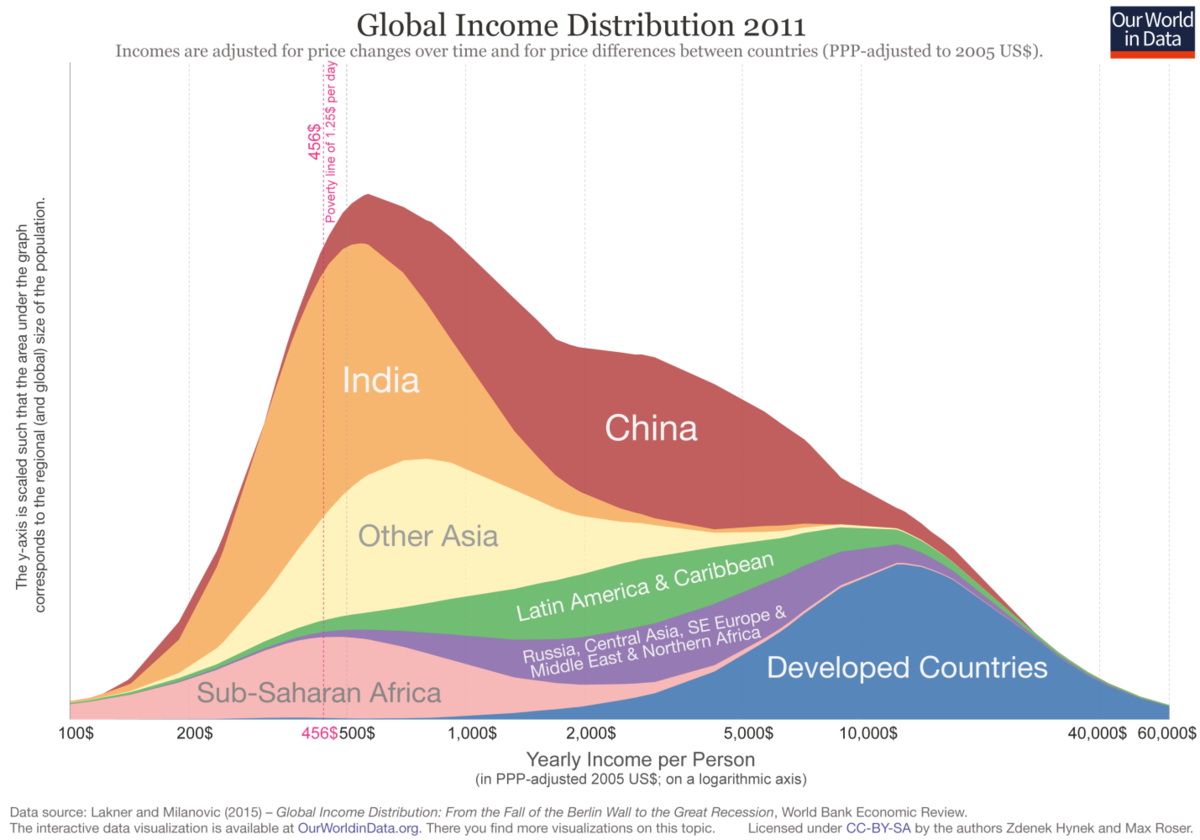
7. On the Figure 4, I am extremely shocked to see how much skewed the Global income distribution is. How horrifying the difference between haves and have-nots!!! Approximately just 75% of all the income in this world is enjoyed by 25% of the people.
8. We noted above that 10% of UK population owns about 43% of the wealth in the UK. I think, this data should be considered as a outlier only. We have to consider the 57% wealth and 90% population to arrive at the average income. All the national policies, budgets etc., should consider this derived median income as one of the important data while finalizing.
9. Let us compare the debt of the 2 countries and the debt of the average citizen from the 2.
From Item #5 in Table 1, we can infer that the UK has a debt of 102.64 % of GDP (It consumes more than it produces). On the contrary, India has a debt of 84.68 % of GDP.
Debt burden of an average indian citizen is 1.16 lakhs or GBP 1130 which is 30 % of the median income.
Debt burden of an average UK citizen is GBP 33410 which is 100.5% of the median income !
10. Considering the modified median income from the above point, certain time tested parameters, indicative of 'affordability' - like
house price as number of 'times' the medium income
rental income as '% 'of 'the median income'
living expenses as number of 'times' the median income
Average savings as number of 'times' the median income
Average pension savings as number of 'times' the median income
etc., shoule be tracked as macro economic indicators.
11. If an average person is having a sense of financial insecurity constantly, then it starts to affect him/her psychologically.He starts to get disturbing questions in his mind on a constant basis.
Will my savings last for my retirement?
WIll I have mobility/energy to continue working post retirement?
Will I complete my mortgage on time?
When will I clear my credit card debts?
Is vacationing too expensive these days? Should I avoid them?
etc.,
To overcome these large life impacting issues, I recommend the below 2 suggestions preferably enforced through an iron clad constitution:
1. Wealth Distribution
2. Universal basic Income
3. Free education till any levels so that an average person feels motivated to fgo to an university to get a higher education that will make him eligible for a high valued high paying job.
APPENDIX:
Figure 1: Income Distribution in UK

Figure 2 : Income Distribution in India

Figure 3: ChartNo :1 in the link - https://80000hours.org/2017/04/how-accurately-does-anyone-know-the-global-distribution-of-income/
Figure 4: Global Income Distribution

Hari Om!